Unity3D高级手册01:分析器(Profiler)
2014-08-14 20:53:37|?次阅读|上传:huigezrx【已有?条评论】发表评论
关键词:Unity3D, 游戏, 虚拟现实|来源:唯设编程网
Unity Manual > Advanced > Profiler
Unity手册->高级->分析器
Profiler分析器
The Unity Profiler helps you to optimize your game. It reports for you how much time is spent in the various areas of your game. For example, it can report the percentage of time spent rendering, animating or in your game logic.
Untiy分析器帮助你优化你的游戏。它为你报告花费多少时间在你的游戏各个领域里。例如,它可以报告花费的时间百分比用于渲染,动画,或在你的游戏逻辑。
The profiler was added at Unity version 2.6. It is a Unity Pro feature. 分析器是加在Unity版本2.6里。这是一个Unity专业版的功能。
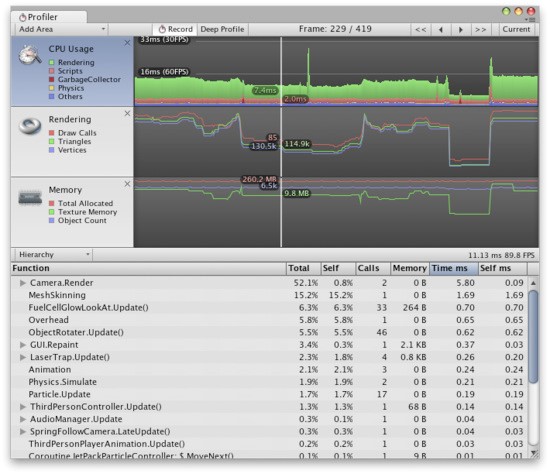
You can play your game in the Editor with Profiling on, and it will record performance data. The Profiler window then displays the data in a timeline, so you can see the frames or areas that spike (take more time) than others. By clicking anywhere in the timeline, the bottom section of the Profiler window will display detailed information for the selected frame.
你可以在编辑器里播放你的游戏并开启分析,它将记录性能数据。 分析器窗口然后在一个时间线里显示数据,因此可以看到框架或区域,峰值(需要更多的时间)超过其它的。按一下在任何时间,该事件分析器窗口底部的部分将显示选定的帧的详细信息。
Note that profiling has to instrument your code. This instrumentation has a small impact on the performance of your game. Typically this overhead is small enough to not affect the game framerate. When using profiling it is typical to consider only the ratio (or percentage) of time spent in certain areas. Also, to improve performance focus on those parts of the game that consume the most time. Compare profiling results before and after code changes and determine the improvements you measure. Sometimes changes you make to improve performance might have a negative effect on frame rate; unexpected consequences of code optimization should be expected.
请注意,要分析器必须分析你的代码。这种仪器拥有对你的游戏的性能影响很小。一般来说,这个开销是足够小,不会影响游戏的帧率。当使用分析它通常只考虑比率(或百分比在某些区域所花的时间)。此外,为了提高性能对游戏的部分消耗最多的焦点。比较前后修改代码,并确定你的改进措施以及分析结果。有时会改变你对提高性能可能会对帧速率的产生负面效应;代码优化意想不到的后果应被预期。
Profiler window 分析器窗口
Profiler Controls 分析器控制

Profiler controls are in the toolbar at the top of the window. Use these to turn profiling on and off, navigate through profiled frames and so on. The transport controls are at the far right end of the toolbar. Note that when the game is running and the profiler is collecting data clicking on any of these transport controls will pause the game. The controls go to the first recorded frame, step one frame back, step one frame forward and go to the last frame respectively. The profiler does not keep all recorded frames, so the notion of the first frame should really be though of as the oldest frame that is still kept in memory. The "current" transport button causes the profile statistics window to display data collected in real-time.
分析器控制在工具栏在窗口的顶部。使用这些分析打开和关闭,浏览分析框架等。传输控制在工具栏的最右侧。请注意,当游戏运行和分析器正在收集数据,点击任何这些传输控制将暂停游戏。这些控制转到第一个记录的框架,一步一帧回来,一步一帧前进到各自的最后一帧。分析器并没有记录全部的帧,所以第一帧的概念真正应该作为最原始的框架仍然保存在内存中。 “当前”传输按钮导致统计分析窗口去显示的实时收集的数据。
Deep Profiling 深度分析
When you turn on Deep Profile, all your script code is profiled - that is, all function calls are recorded. This is useful to know where exactly time is spent in your game code.
当你打开深度分析,所有的脚本代码被分析--也就是说,所有的函数调用记录。这用于去了解准确时间应用到何处在你的游戏代码里。
Note that Deep Profiling incurs a very large overhead and uses a lot of memory, and as a result your game will run significantly slower while profiling. If you are using complex script code, Deep Profiling might not be possible at all. Deep profiling should work fast enough for small games with simple scripting. If you find that Deep Profiling for your entire game causes the frame rate to drop so much that the game barely runs, you should consider not using this approach, and instead use the approach described below. You may find deep profiling more helpful as you are designing your game and deciding how to best implement key features. Note that for large games deep profiling may cause Unity to run out of memory and so for this reason deep profiling may not be possible.
请注意,深度分析导致一个非常大的开销,使用了大量的内存,因此你的游戏运行显著降低在分析过程中。如果你正在使用复杂的脚本代码,深度分析可能无法分析所有。深度分析应工作足够快对于简单的脚本小游戏。如果你发现为你的整整个游戏深度分析导致刚刚运行的游戏帧速率下降很多,你应该考虑不使用这种方法,而是使用如下介绍的方法。你可能会发现深度的分析提供更多帮助在你设计你的游戏时,并决定如何最好地实现主要功能。请注意,对于大型游戏的深度分析可能导致Unity的运行内存不足,为此深度分析可能无法接受。
Manually profiling blocks of your script code will have a smaller overhead than using Deep Profiling. Use Profiler.BeginSample and Profiler.EndSample scripting functions to enable and disable profiling around sections of code.
手工分析你的脚本代码块将有一个使用小的开销与使用深度分析相比。使用Profiler.BeginSample和Profiler.EndSample脚本函数启用或禁止分析代码段。
Profiler Timeline 时间线分析器
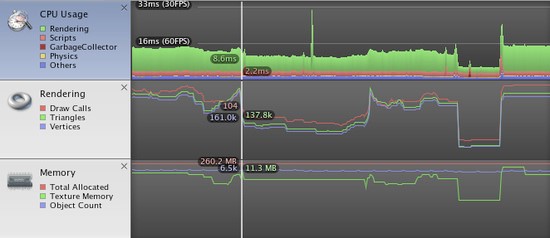
The upper part of the Profiler window displays performance data over time. When you run a game, data is recorded each frame, and the history of the last several hundred frames is displayed. Clicking on a particular frame will display it's details in the lower part of the window. Different details are displayed depending on which timeline area is currently selected.

 CATIA/CAA
 SWING
SWING MFC
MFC Unity3D
 Android
 JQuery
 ASP.NET