Unity3D高级手册01:分析器(Profiler)
2014-08-14 20:53:37|?次阅读|上传:huigezrx【已有?条评论】发表评论
关键词:Unity3D, 游戏, 虚拟现实|来源:唯设编程网
在分析器窗口的上部中显示随着时间的推移性能数据。当你运行一个游戏,数据记录每一帧,并显示过去几百帧的历史。点击某一帧将在窗口的下半部分显示它的细节。不同细节的显示取决于时间区的当前选择。
The vertical scale of the timeline is managed automatically and will attempt to fill the vertical space of the window. Note that to get more detail in say the CPU Usage area you can remove the Memory and Rendering areas. Also, the splitter between the timeline and the statistics area can be selected and dragged downward to increase the screen area used for the timeline chart.
时间线的纵坐标是自动管理并尝试填补窗口的垂直空间。请注意,要获得更详细地在你可以删除内存和渲染领域的CPU使用率区域中说明。此外,在时间线和统计领域之间的分析器可以被选择和向下拖动以增加屏幕面积的时间表图表的使用。
The timeline consists of several areas: CPU Usage, Rendering and Memory. These areas can be removed by clicking the close button in the panel, and re-added again using the Add Area drop down in the Profile Controls bar.
时间线包括几个方面:CPU使用率,渲染和内存。这些领域可以移除通过单击面板关闭按钮,并重新添加再次使用新增面积下降在分析控制栏里。
CPU Usage Area CPU利用率

The CPU Usage area displays where time is spent in your game. When it is selected, the lower pane displays hierarchical time data for the selected frame.
CPU使用率区域显示在你的游戏哪里的时间是被用过的。当它被选中,下部窗格显示分层的实时数据。
- Hierarchy mode - displays hierarchical time data. 层次模式—显示层次时间数据
- Group Hierarchy mode - groups time data into logical groups (Rendering, Physics, Scripts etc.).
- 层次群模式—逻辑组里的群时间数据(渲染、物理、脚本等)。
Because children of any group can be in different group (e.g. some script might call rendering functions), the percentages of group times often add up to more than 100%. (This is not a bug.)
因为任何组的可在不同的组里(例如:一些脚本也许调用渲染函数),组时间的百分比常常总计超过100%(这是一个BUG)。
The way the CPU chart is stacked can be reordered by simply dragging chart labels up & down.
在CPU的图表方法是堆积可以通过简单的拖动图表标签升降排序。
When an item it selected in the lower pane, it's contribution to the CPU chart is highlighted (and the rest are dimmed). Clicking on an item again de-selects it.
当一个项目是在较低的窗格中选中,它的贡献是突出的CPU图表(并变灰)。在一个项目再次点击取消选择它。
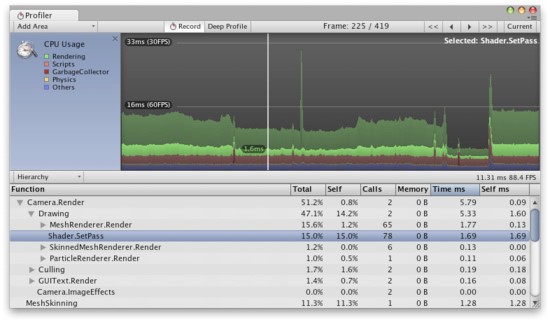
Shader.SetPass is selected and it's contribution is highlighted in the chart.
Shader.SetPass被选中,它的贡献是在图表中突出显示。
In the hierarchical time data the self time refers to the amount of time spent in a particular function not including the time spent calling sub-functions. In the screenshot above, for example 51.2% of time is spent in the Camera.Render function. This function does a lot of work and calls the various drawing and culling functions. Excluding all these functions only 0.8% of time is spent actually in the Camera.Render function.
在分层时间数据的自我时间是指在某一特定功能所用的时间不包括调用子功能所花费的时间。在上面的截图里,例如51.2%的时间,花费在Camera.Render函数上。这个函数做了大量工作并调用若干绘画函数和精选函数。除去所有这些只有0.8%的时间花费在Camera.Render函数实际功能上。
Rendering Area 渲染区域
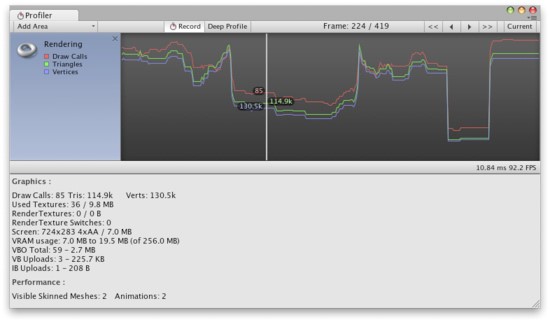
The Rendering area displays rendering statistics. The Number of Draw Calls, Triangles and Vertices rendered is displayed graphical in the timeline. The Lower pane displays more rendering statistics and these more closely match the ones shown in the GameView Rendering Statistics window.
渲染区域显示的渲染统计。绘制调用的数量,三角形和顶点渲染是在时间线中显示图形。下部窗格显示更多的渲染统计而这些更紧密的配合显示在GameView的渲染统计窗口。
Memory Area 内存区域
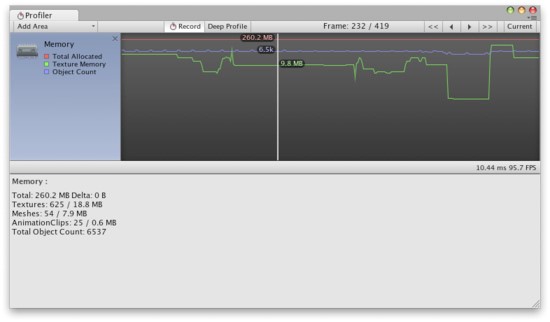
The Memory area displays some memory usage data: 内存区域显示内存使用的一些数据:
Total Allocated is the total RAM used by the application. Note that in the Unity Editor this is memory used by everything in the editor; game builds will use much less.
总分配内存是应用程序使用内存的合计。请注意,在Unity的编辑器,这是在编辑器中所使用的一切内存;游戏编译使用较少。
Texture Memory is the about of video memory used by the textures in the current frame.
纹理内存是关于纹理使用的显存在当前游戏里。
Object Count is the total number of Objects that are created. If this number rises over time then it means your game is creating some objects that are never destroyed.
对象计数是创建的对象总数。如果这个数字随着时间的推移上升那么这意味着你的游戏的创建的一些对象从未释放过。
See Also参见
- Optimizing Graphics Performance page.优化的图形性能页。

 CATIA/CAA
 SWING
SWING MFC
MFC Unity3D
 Android
 JQuery
 ASP.NET