Java使用JFreeChar绘制折线图并保存到图像文件
2012-03-30 21:39:16|?次阅读|上传:wustguangh【已有?条评论】发表评论
关键词:Java, Swing, 界面设计|来源:唯设编程网
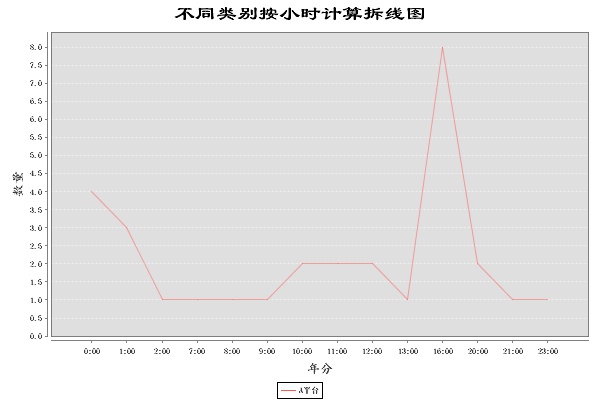
前面的文章介绍了使用JFreeChart绘制柱形图,本文将介绍JFreeChart绘制折线图的方法,并将其保存图像文件中,本文将会给出实际的Java源代码,首先展示折线统计图的效果如图:
Java代码:
package Test.JFreeChar;

import java.awt.Font;
import java.io.File;
import java.io.FileNotFoundException;
import java.io.FileOutputStream;
import java.io.IOException;

import org.jfree.chart.ChartFactory;
import org.jfree.chart.ChartUtilities;
import org.jfree.chart.JFreeChart;
import org.jfree.chart.StandardChartTheme;
import org.jfree.chart.plot.CategoryPlot;
import org.jfree.chart.plot.PlotOrientation;
import org.jfree.data.category.CategoryDataset;
import org.jfree.data.general.DatasetUtilities;

//JFreeChart Line Chart(折线图)
public class CreateJFreeChartLine {

    public static void main(String[] args) {
        // 步骤1:创建CategoryDataset对象(准备数据)
        CategoryDataset dataset = createDataset();
        // 步骤2:根据Dataset 生成JFreeChart对象,以及做相应的设置
        JFreeChart freeChart = createChart(dataset);
        // 步骤3:将JFreeChart对象输出到文件,Servlet输出流等
        saveAsFile(freeChart, "c:jfreechartline.jpg", 600, 400);
    }

    // 保存为文件
    public static void saveAsFile(JFreeChart chart, String outputPath,
            int weight, int height) {
        FileOutputStream out = null;
        try {
            File outFile = new File(outputPath);
            if (!outFile.getParentFile().exists()) {
                outFile.getParentFile().mkdirs();
            }
            out = new FileOutputStream(outputPath);
            // 保存为PNG
            // ChartUtilities.writeChartAsPNG(out, chart, 600, 400);
            // 保存为JPEG
            ChartUtilities.writeChartAsJPEG(out, chart, 600, 400);
            out.flush();
        } catch (FileNotFoundException e) {
            e.printStackTrace();
        } catch (IOException e) {
            e.printStackTrace();
        } finally {
            if (out != null) {
                try {
                    out.close();
                } catch (IOException e) {
                    // do nothing
                }
            }
        }
    }

    // 根据CategoryDataset创建JFreeChart对象
    public static JFreeChart createChart(CategoryDataset categoryDataset) {
        //这里的"name"参数;是什么意思我也不知道,反正这样可以用
        StandardChartTheme standardChartTheme = new StandardChartTheme("name");
        //可以改变轴向的字体
        standardChartTheme.setLargeFont(new Font("楷体",Font.BOLD, 12));
        //可以改变图例的字体
        standardChartTheme.setRegularFont(new Font("宋体",Font.BOLD, 8));
        //可以改变图标的标题字体
        standardChartTheme.setExtraLargeFont(new Font("隶书",Font.BOLD, 20));
        ChartFactory.setChartTheme(standardChartTheme);//设置主题
        // 创建JFreeChart对象:ChartFactory.createLineChart
        JFreeChart jfreechart =
            ChartFactory.createLineChart("不同类别按小时计算拆线图", // 标题
                "年分", // categoryAxisLabel (category轴,横轴,X轴标签)
                "数量", // valueAxisLabel(value轴,纵轴,Y轴的标签)
                categoryDataset, // dataset
                PlotOrientation.VERTICAL, true, // legend
                false, // tooltips
                false); // URLs

        // 使用CategoryPlot设置各种参数。以下设置可以省略。
        CategoryPlot plot = (CategoryPlot) jfreechart.getPlot();
        // 背景色 透明度
        plot.setBackgroundAlpha(0.5f);
        // 前景色 透明度
        plot.setForegroundAlpha(0.5f);
        // 其他设置 参考 CategoryPlot类

        return jfreechart;
    }
    /**
     * 创建数据集
     * @return
     */
    public static CategoryDataset createDataset() {

        String[] rowKeys = { "A平台" };
        String[] colKeys = { "0:00", "1:00", "2:00", "7:00", "8:00", "9:00",
                "10:00", "11:00", "12:00", "13:00", "16:00", "20:00", "21:00",
                "23:00" };

        double[][] data = { { 4, 3, 1, 1, 1, 1, 2, 2, 2, 1, 8, 2, 1, 1 }, };

        // 或者使用类似以下代码
        // DefaultCategoryDataset categoryDataset = new
        // DefaultCategoryDataset();
        // categoryDataset.addValue(10, "rowKey", "colKey");

        return DatasetUtilities.createCategoryDataset(rowKeys, colKeys, data);
    }
}
至此,Java使用JFreeChart绘制折线图的实例便完成了,依然要提醒读者要注意的是下面这段代码:
         //这里的"name"参数;是什么意思我也不知道,反正这样可以用
        StandardChartTheme standardChartTheme = new StandardChartTheme("name");
        //可以改变轴向的字体
        standardChartTheme.setLargeFont(new Font("楷体",Font.BOLD, 12));
        //可以改变图例的字体
        standardChartTheme.setRegularFont(new Font("宋体",Font.BOLD, 8));
        //可以改变图标的标题字体
        standardChartTheme.setExtraLargeFont(new Font("隶书",Font.BOLD, 20));
        ChartFactory.setChartTheme(standardChartTheme);//设置主题
如果没有对字体进行设置,包含中文内容的统计图表可能无法正常显示哦!
【发表评论0条 】
网友评论(共?条评论)..
Java使用JFreeChar绘制折线图并保存到图像文件

 CATIA/CAA
 SWING
SWING MFC
MFC Unity3D
 Android
 JQuery
 ASP.NET