使用JFreeChart创建2D和3D饼形统计图文件
2012-03-30 21:51:45|?次阅读|上传:wustguangh【已有?条评论】发表评论
关键词:Java, Swing, 界面设计|来源:唯设编程网
前面的文章介绍了Java使用JFreeChart绘制柱状图和折线图的方法,本文继续介绍JFreeChart的使用方法,本文将着重介绍JFreeChart绘制饼形图的方法,包括2D饼形图和3D饼形图。JFreeChart对图像文件的保存提供了方便的API支持,本文也介绍了将JFreeChart绘制的统计图保存为图像文件的方法。
首先展示程序生成的图像文件:
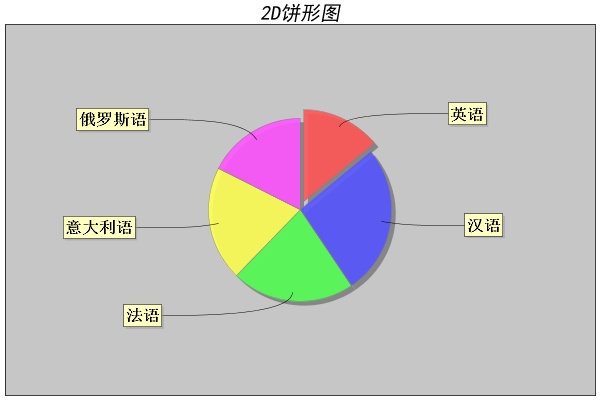
2D饼形图:
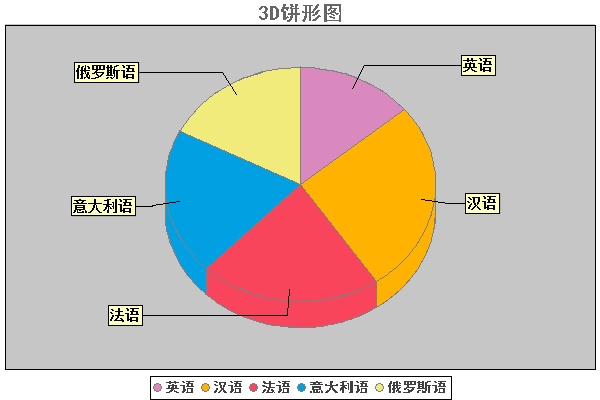
3D饼形图:
Java代码:
package Test.JFreeChar;

import java.awt.Color;
import java.awt.Font;
import java.awt.RenderingHints;
import java.io.File;
import java.io.FileNotFoundException;
import java.io.FileOutputStream;
import java.io.IOException;

import org.jfree.chart.ChartFactory;
import org.jfree.chart.ChartUtilities;
import org.jfree.chart.JFreeChart;
import org.jfree.chart.plot.PieLabelLinkStyle;
import org.jfree.chart.plot.PiePlot;
import org.jfree.chart.plot.PiePlot3D;
import org.jfree.chart.title.LegendTitle;
import org.jfree.chart.title.TextTitle;
import org.jfree.data.general.DefaultPieDataset;
import org.jfree.util.Rotation;

/**
 * 创建饼形图类
 */
public class PieChartDemo {

    /**
     * 创建一个数据源(dataset):
     * @return
     */
    private static DefaultPieDataset getDataSet() {

        DefaultPieDataset defaultPieDataset = new DefaultPieDataset();
        defaultPieDataset.setValue("英语", 20000);
        defaultPieDataset.setValue("汉语", 38000);
        defaultPieDataset.setValue("法语", 31000);
        defaultPieDataset.setValue("意大利语", 29000);
        defaultPieDataset.setValue("俄罗斯语", 25000);

        return defaultPieDataset;
    }

    /**
     * 由ChartFactory产生JFreeChart对象普通饼图
     * @return
     */
    public static JFreeChart create2DPie(String tableName,
            DefaultPieDataset dataset) {

        // DefaultPieDataset dataset = getDataSet();//数据源

        JFreeChart jfreechart = ChartFactory.createPieChart("语言统计", // 图表标题名称
                dataset, // 数据源
                false, // 是否显示图例(对于简单的柱状图必须是false)
                false, // 是否生产工具
                false // 是否生成URL链接
                );

        jfreechart.setTitle(new TextTitle(tableName, new Font("黑体",
                Font.ITALIC, 20)));// 重新设置图表标题,改变字体
        jfreechart.getTitle().setFont(new Font("黑体", Font.ITALIC, 20)); // 解决标题乱码

        // LegendTitle legendTitle = jfreechart.getLegend(0); //取得统计图表的第一个图例
        //
        // legendTitle.setItemFont(new Font("宋体",Font.ITALIC,14));//修改图例的字体

        PiePlot plot = (PiePlot) jfreechart.getPlot(); // 获得饼图的Plot对象
        plot.setLabelFont(new Font("宋体", Font.BOLD, 16)); // 设置饼图各部分的标签字体

        plot.setNoDataMessage("No data available");
        plot.setCircular(true);
        plot.setLabelGap(0.1D);// 间距

        plot.setBackgroundAlpha(0.9f);// 设置背景透明度(0-1.0之间)
        plot.setForegroundAlpha(0.9f);// 设置前景透明度(0-1.0之间)
        plot.setExplodePercent(0, 0.1D); // 把Lable 为”One” 的那一块”挖”出来30%

        return jfreechart;
    }

    /**
     * 3D饼状图
     * @param dataset 数据集
     * @param charName 生成图的名字
     * @return
     */
    public static JFreeChart create3DPie(String tableName,
            DefaultPieDataset dataset) {

        JFreeChart chart = ChartFactory.createPieChart3D("统计", dataset, true,
                true, false);
        PiePlot3D plot = (PiePlot3D) chart.getPlot();
        plot.getLabelLinkStyle();
        // plot.setStartAngle(290D);
        // plot.setDirection(Rotation.CLOCKWISE);
        // plot.setForegroundAlpha(0.5F);
        // plot.setNoDataMessage("No data to display");
        plot.setLabelLinkStyle(PieLabelLinkStyle.QUAD_CURVE);

        // 使下说明标签字体清晰,去锯齿类似于的效果
        chart.getRenderingHints().put(RenderingHints.KEY_TEXT_ANTIALIASING,
                RenderingHints.VALUE_TEXT_ANTIALIAS_OFF);
        chart.setAntiAlias(false);
        // 图片背景色

        chart.setBackgroundPaint(Color.WHITE);
        // 设置图标题的字体重新设置title

        // 设置标题的颜色
        TextTitle text = new TextTitle(tableName);
        text.setPaint(new Color(102, 102, 102));
        chart.setTitle(text);
        chart.getTitle().setFont(new Font("黑体", Font.BOLD, 20)); // 解决标题乱码
        LegendTitle legendTitle = chart.getLegend(0); // 取得统计图表的第一个图例
        legendTitle.setItemFont(new Font("黑体", Font.BOLD, 14));// 修改图例的字体
        // plot.setBackgroundPaint(new Color(255, 253, 246));
        // plot.setOutlineStroke(new BasicStroke(1.5f));
        // plot.setMaximumLabelWidth(0.25d);
        // 图片中显示百分比:默认方式

        // 设置各色块的颜色
        plot.setSectionPaint(0, new Color(218, 137, 190));
        plot.setSectionPaint(1, new Color(255, 179, 0));
        plot.setSectionPaint(2, new Color(249, 69, 91));
        plot.setSectionPaint(3, new Color(0, 160, 226));
        plot.setSectionPaint(4, new Color(240, 235, 122));

        plot.setShadowXOffset(1.0d);
        plot.setIgnoreZeroValues(false);
        plot.setStartAngle(90); // 设置旋转角度
        plot.setDirection(Rotation.CLOCKWISE); // 设置旋转方向
        plot.setForegroundAlpha(0.9f);
        // 设置饼形图的外观效果,例如圆形(True)或椭圆形(False),
        //默认为圆形,建议在绘制3D效果图时将其设为False
        plot.setCircular(false);

        plot.setLabelLinkMargin(0.1);
        plot.setSectionOutlinesVisible(false);
        plot.setDepthFactor(0.1d);// 饼图的Z轴高度。

        plot.setBackgroundAlpha(0.9f);// 设置背景透明度(0-1.0之间)

        // 设置无数据时的信息
        plot.setNoDataMessage("No data available");
        plot.setNoDataMessageFont(new Font("", Font.ITALIC, 14));

        // 设置无数据时的信息显示颜色
        plot.setNoDataMessagePaint(new Color(87, 149, 117));

        // // 图片中显示百分比:自定义方式,{0} 表示选项, {1} 表示数值, {2} 表示所占比例 ,小数点后两位
        // plot.setLabelGenerator(new StandardPieSectionLabelGenerator(
        // "{0} ={1}%", NumberFormat.getNumberInstance(),
        // new DecimalFormat("0.00%")));
        // // 图例显示百分比:自定义方式, {0} 表示选项, {1} 表示数值, {2} 表示所占比例

        // plot.setLegendLabelGenerator(new StandardPieSectionLabelGenerator(
        // "{0} ={1}%"));

        // 指定图片的透明度(0.0-1.0)
        plot.setForegroundAlpha(1f);
        plot.setLabelFont(new Font("宋体", Font.BOLD, 14)); // 设置饼图各部分的标签字体

        return chart;
    }

    // 保存为文件
    public static void saveAsFile(JFreeChart chart, String outputPath,
            int weight, int height) {
        FileOutputStream out = null;
        try {
            File outFile = new File(outputPath);
            if (!outFile.getParentFile().exists()) {
                outFile.getParentFile().mkdirs();
            }
            out = new FileOutputStream(outputPath);
            // 保存为PNG
            // ChartUtilities.writeChartAsPNG(out, chart, 600, 400);
            // 保存为JPEG
            ChartUtilities.writeChartAsJPEG(out, chart, 600, 400);
            out.flush();
        } catch (FileNotFoundException e) {
            e.printStackTrace();
        } catch (IOException e) {
            e.printStackTrace();
        } finally {
            if (out != null) {
                try {
                    out.close();
                } catch (IOException e) {
                    // do nothing
                }
            }
        }
    }

    public static void main(String[] args) {
        // 步骤1:创建CategoryDataset对象(准备数据)
        // 步骤2:根据Dataset 生成JFreeChart对象,以及做相应的设置
        // 步骤3:将JFreeChart对象输出到文件,Servlet输出流等
        saveAsFile(create2DPie("2D饼形图", getDataSet()),
                "C:jfreechartpie2D.jpg", 600, 400);
        saveAsFile(create3DPie("3D饼形图", getDataSet()),
                "C:jfreechartpie3D.jpg", 600, 400);
    }
}
至此,使用JFreeChart绘制饼形图的完整实例便完成了,读者可以根据给出的代码,修改后实现自己需要的功能。
【发表评论0条 】
网友评论(共?条评论)..
使用JFreeChart创建2D和3D饼形统计图文件

 CATIA/CAA
 SWING
SWING MFC
MFC Unity3D
 Android
 JQuery
 ASP.NET