Java使用JFreeChart绘制时序图(TimeSeries)
2012-03-30 22:02:32|?次阅读|上传:wustguangh【已有?条评论】发表评论
关键词:Java, Swing, 界面设计|来源:唯设编程网
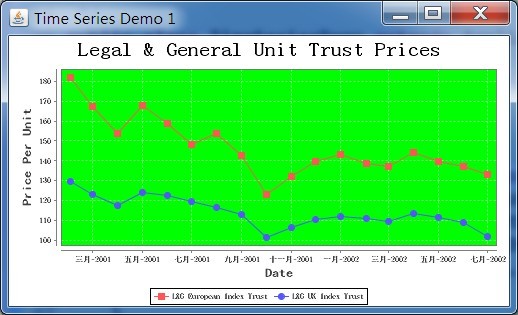
前面的文章介绍了Java使用JFreeChart绘制柱状图、折线图和饼形图的方法,本文继续介绍JFreeChart的使用方法,本文将着重介绍Swing客户端程序使用 JFreeChart在窗体中绘制时序图的方法,依然会给出程序的运行效果和实际的Java源代码。
首先展示程序的运行效果:
package Test.JFreeChar;

import java.awt.Color;
import java.awt.Dimension;
import java.awt.Font;
import java.io.IOException;
import java.io.PrintWriter;
import java.text.SimpleDateFormat;

import javax.servlet.http.HttpSession;
import javax.swing.JPanel;

import org.jfree.chart.ChartFactory;
import org.jfree.chart.ChartPanel;
import org.jfree.chart.ChartRenderingInfo;
import org.jfree.chart.ChartUtilities;
import org.jfree.chart.JFreeChart;
import org.jfree.chart.StandardChartTheme;
import org.jfree.chart.axis.DateAxis;
import org.jfree.chart.entity.StandardEntityCollection;
import org.jfree.chart.plot.XYPlot;
import org.jfree.chart.renderer.xy.XYLineAndShapeRenderer;
import org.jfree.chart.servlet.ServletUtilities;
import org.jfree.data.time.Month;
import org.jfree.data.time.TimeSeries;
import org.jfree.data.time.TimeSeriesCollection;
import org.jfree.data.xy.XYDataset;
import org.jfree.ui.ApplicationFrame;
import org.jfree.ui.RectangleInsets;
import org.jfree.ui.RefineryUtilities;
/**
 * JFreeChar时序图例子
 *
 */
public class TimeSeriesDemo extends ApplicationFrame {

    private static final long serialVersionUID = -4172191391806537567L;

    public TimeSeriesDemo(String s) {
        super(s);
        XYDataset xydataset = createDataset();
        JFreeChart jfreechart = createChart(xydataset);
        ChartPanel chartpanel = new ChartPanel(jfreechart, false);
        chartpanel.setPreferredSize(new Dimension(500, 270));
        chartpanel.setMouseZoomable(true, false);
        setContentPane(chartpanel);
    }

    private static JFreeChart createChart(XYDataset xydataset) {
        //这里的"name"参数;是什么意思我也不知道,反正这样可以用
        StandardChartTheme standardChartTheme = new StandardChartTheme("name");
        //可以改变轴向的字体
        standardChartTheme.setLargeFont(new Font("楷体",Font.BOLD, 12));
        //可以改变图例的字体
        standardChartTheme.setRegularFont(new Font("宋体",Font.BOLD, 8));
        //可以改变图标的标题字体
        standardChartTheme.setExtraLargeFont(new Font("隶书", Font.BOLD, 20));
        ChartFactory.setChartTheme(standardChartTheme);// 设置主题
        JFreeChart jfreechart = ChartFactory.createTimeSeriesChart(
                "Legal & General Unit Trust Prices", "Date", "Price Per Unit",
                xydataset, true, true, true);
        jfreechart.setBackgroundPaint(Color.white);
        XYPlot xyplot = (XYPlot) jfreechart.getPlot();
        xyplot.setBackgroundPaint(Color.GREEN);
        xyplot.setDomainGridlinePaint(Color.white);
        xyplot.setRangeGridlinePaint(Color.white);
        xyplot.setAxisOffset(new RectangleInsets(5D, 5D, 5D, 5D));
        xyplot.setDomainCrosshairVisible(true);
        xyplot.setRangeCrosshairVisible(true);
        org.jfree.chart.renderer.xy.XYItemRenderer xyitemrenderer = xyplot
                .getRenderer();
        if (xyitemrenderer instanceof XYLineAndShapeRenderer) {
            XYLineAndShapeRenderer xylineandshaperenderer = (XYLineAndShapeRenderer) xyitemrenderer;
            xylineandshaperenderer.setBaseShapesVisible(true);
            xylineandshaperenderer.setBaseShapesFilled(true);
        }
        DateAxis dateaxis = (DateAxis) xyplot.getDomainAxis();
        dateaxis.setDateFormatOverride(new SimpleDateFormat("MMM-yyyy"));
        return jfreechart;
    }

    private static XYDataset createDataset() {
        TimeSeries timeseries = new TimeSeries("L&G European Index Trust",
                org.jfree.data.time.Month.class);
        timeseries.add(new Month(2, 2001), 181.80000000000001D);
        timeseries.add(new Month(3, 2001), 167.30000000000001D);
        timeseries.add(new Month(4, 2001), 153.80000000000001D);
        timeseries.add(new Month(5, 2001), 167.59999999999999D);
        timeseries.add(new Month(6, 2001), 158.80000000000001D);
        timeseries.add(new Month(7, 2001), 148.30000000000001D);
        timeseries.add(new Month(8, 2001), 153.90000000000001D);
        timeseries.add(new Month(9, 2001), 142.69999999999999D);
        timeseries.add(new Month(10, 2001), 123.2D);
        timeseries.add(new Month(11, 2001), 131.80000000000001D);
        timeseries.add(new Month(12, 2001), 139.59999999999999D);
        timeseries.add(new Month(1, 2002), 142.90000000000001D);
        timeseries.add(new Month(2, 2002), 138.69999999999999D);
        timeseries.add(new Month(3, 2002), 137.30000000000001D);
        timeseries.add(new Month(4, 2002), 143.90000000000001D);
        timeseries.add(new Month(5, 2002), 139.80000000000001D);
        timeseries.add(new Month(6, 2002), 137D);
        timeseries.add(new Month(7, 2002), 132.80000000000001D);
        TimeSeries timeseries1 = new TimeSeries("L&G UK Index Trust",
                org.jfree.data.time.Month.class);
        timeseries1.add(new Month(2, 2001), 129.59999999999999D);
        timeseries1.add(new Month(3, 2001), 123.2D);
        timeseries1.add(new Month(4, 2001), 117.2D);
        timeseries1.add(new Month(5, 2001), 124.09999999999999D);
        timeseries1.add(new Month(6, 2001), 122.59999999999999D);
        timeseries1.add(new Month(7, 2001), 119.2D);
        timeseries1.add(new Month(8, 2001), 116.5D);
        timeseries1.add(new Month(9, 2001), 112.7D);
        timeseries1.add(new Month(10, 2001), 101.5D);
        timeseries1.add(new Month(11, 2001), 106.09999999999999D);
        timeseries1.add(new Month(12, 2001), 110.3D);
        timeseries1.add(new Month(1, 2002), 111.7D);
        timeseries1.add(new Month(2, 2002), 111D);
        timeseries1.add(new Month(3, 2002), 109.59999999999999D);
        timeseries1.add(new Month(4, 2002), 113.2D);
        timeseries1.add(new Month(5, 2002), 111.59999999999999D);
        timeseries1.add(new Month(6, 2002), 108.8D);
        timeseries1.add(new Month(7, 2002), 101.59999999999999D);
        TimeSeriesCollection timeseriescollection = new TimeSeriesCollection();
        timeseriescollection.addSeries(timeseries);
        timeseriescollection.addSeries(timeseries1);
        return timeseriescollection;
    }

    public static JPanel createDemoPanel() {
        JFreeChart jfreechart = createChart(createDataset());
        return new ChartPanel(jfreechart);
    }

    // 根据JFreeChart对象生成对应的图片
    public static String generateLineChart(HttpSession session, PrintWriter pw) {
        String filename = null;
        JFreeChart chart = createChart(createDataset());
        // chart.setBackgroundPaint(java.awt.Color.white);

        ChartRenderingInfo info = new ChartRenderingInfo(new StandardEntityCollection());
        try {
            filename = ServletUtilities.saveChartAsPNG(chart, 500, 350, info, session);
        } catch (IOException e) {
            e.printStackTrace();
        }
        try {
            ChartUtilities.writeImageMap(pw, filename, info, false);
        } catch (IOException e) {
            e.printStackTrace();
        }
        pw.flush();
        return filename;
    }

    public static void main(String args[]) {
        TimeSeriesDemo timeseriesdemo1 = new TimeSeriesDemo("Time Series Demo 1");
        timeseriesdemo1.pack();
        RefineryUtilities.centerFrameOnScreen(timeseriesdemo1);
        timeseriesdemo1.setVisible(true);
    }
}
好了,详细你已经会利用JFreeChart进行时序图(TimeSeries)的绘制,并将其显示在Swing窗体上了吧!
【发表评论0条 】
网友评论(共?条评论)..
Java使用JFreeChart绘制时序图(TimeSeries)

 CATIA/CAA
 SWING
SWING MFC
MFC Unity3D
 Android
 JQuery
 ASP.NET